What's new in the VMware integration
IT Portal has imported VMware data — virtual centers, hosts, VMs — for a long time. You drop the agent on a collection machine, it uploads to your tenant, and the inventory appears under Viewpoints. That hasn't changed.
What has changed in this release: how that data is presented once it's in the Portal, and how much of it gets captured. The flat property tables you've been clicking through on each VM are now full vSphere-style dashboards. Storage usage trends over time. And every VM keeps a running change-history log of who did what in vCenter — with the raw VMware event text translated into something a human can actually read.
Here's the tour.
vSphere-style dashboards on every VM, host, and vCenter
When a Portal device matches a managed VM, ESXi host, or vCenter, you now get a dedicated VM Info, Host Info, or VCenter Info tab on that device. The layout mirrors what you'd see in vSphere itself — two cards side by side:
- Details — version, build, vendor, model, cluster, host count, VM count, uptime, OS, tags, and whatever else is relevant to the object.
- Capacity — CPU, memory, and storage with progress bars; storage is broken out per datastore.
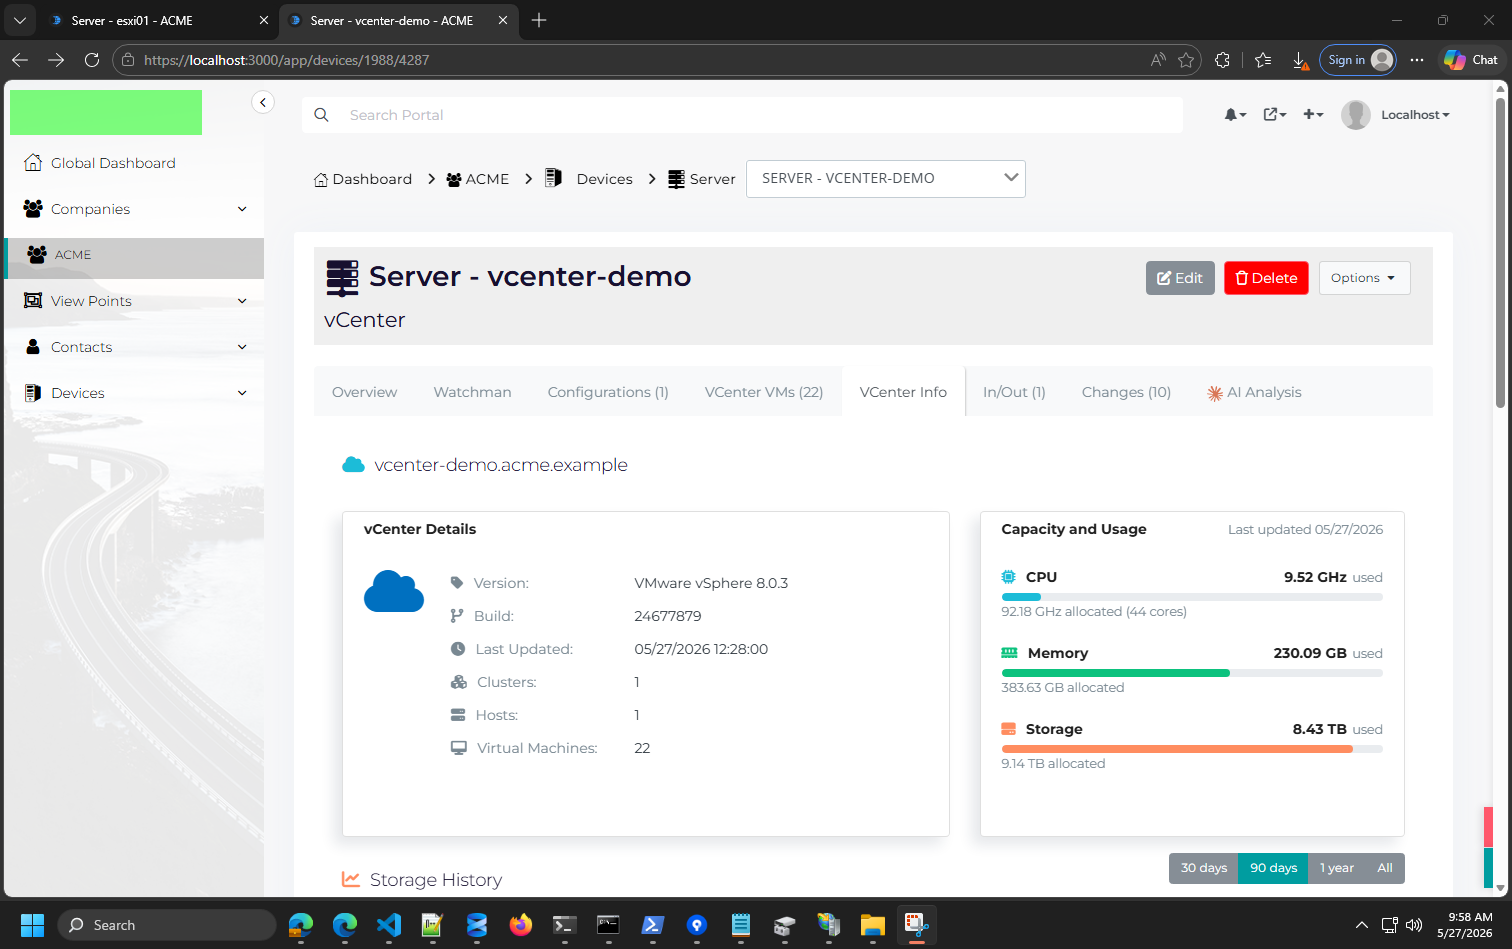
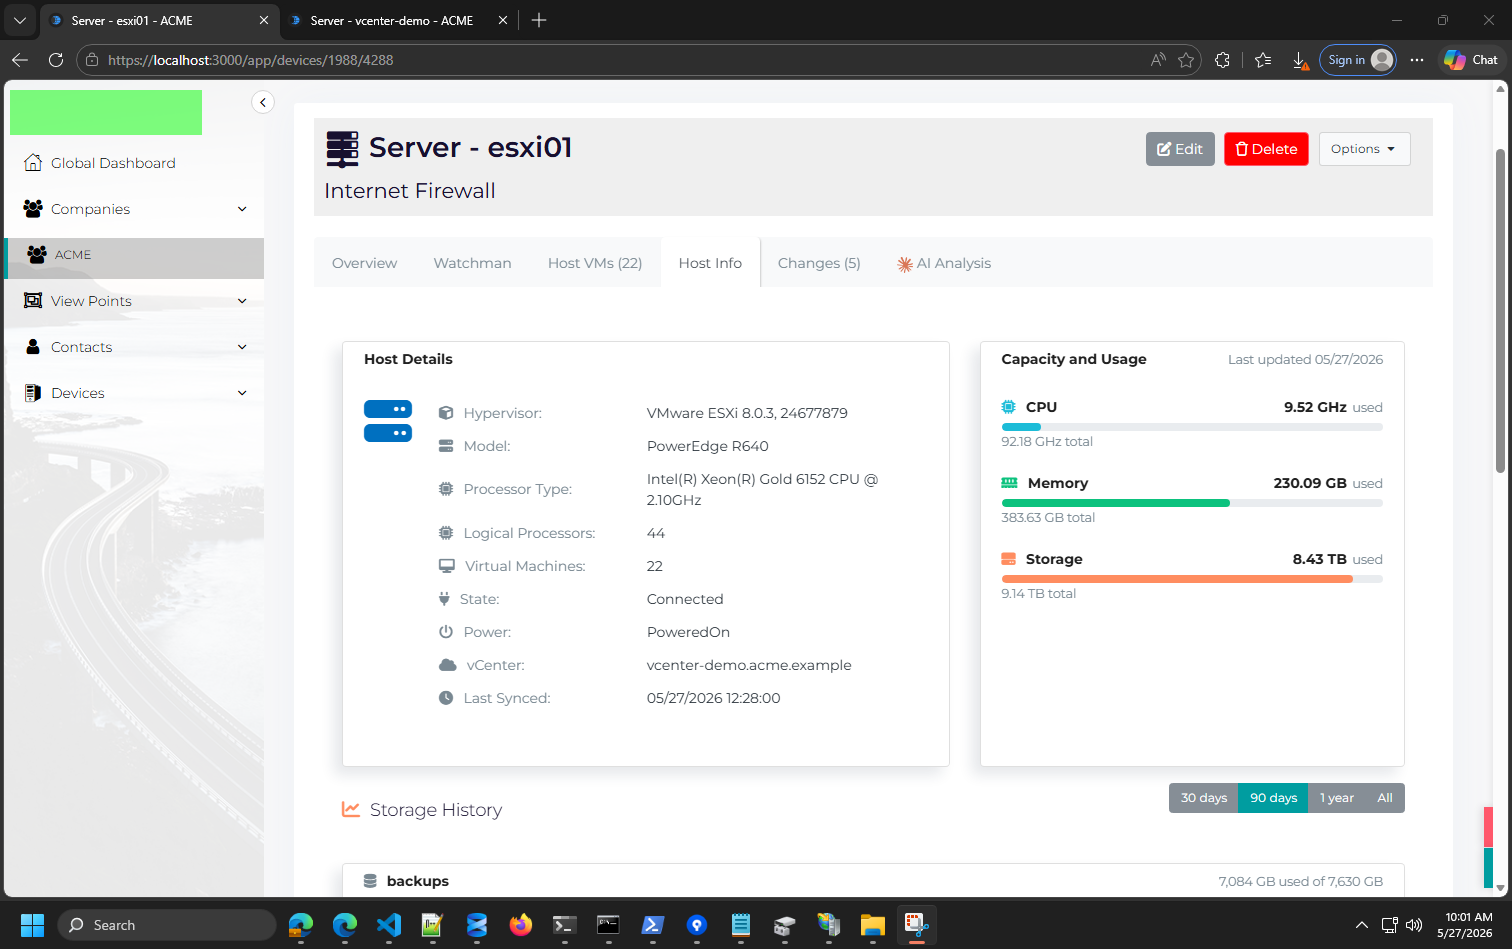
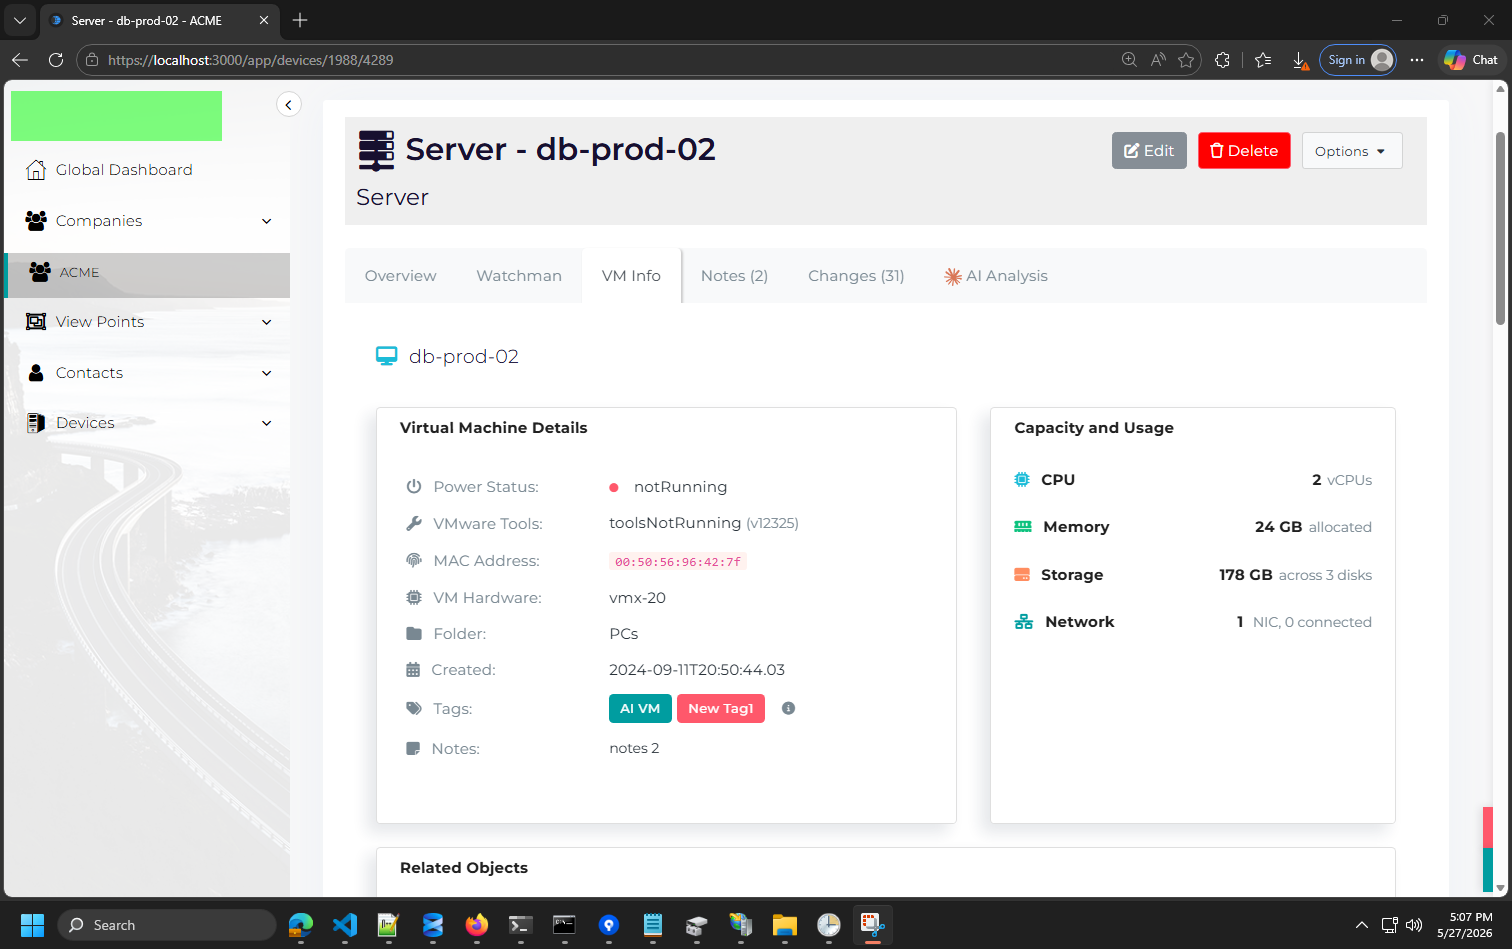
Same data we were already collecting — just laid out the way you'd expect to see it.
Storage growth charts
Each VM, host, and datastore now ships with a storage history chart. 30, 90, or 365 days of usage trended over time so you can see which datastores are filling up, which VMs are growing, and when capacity was added.
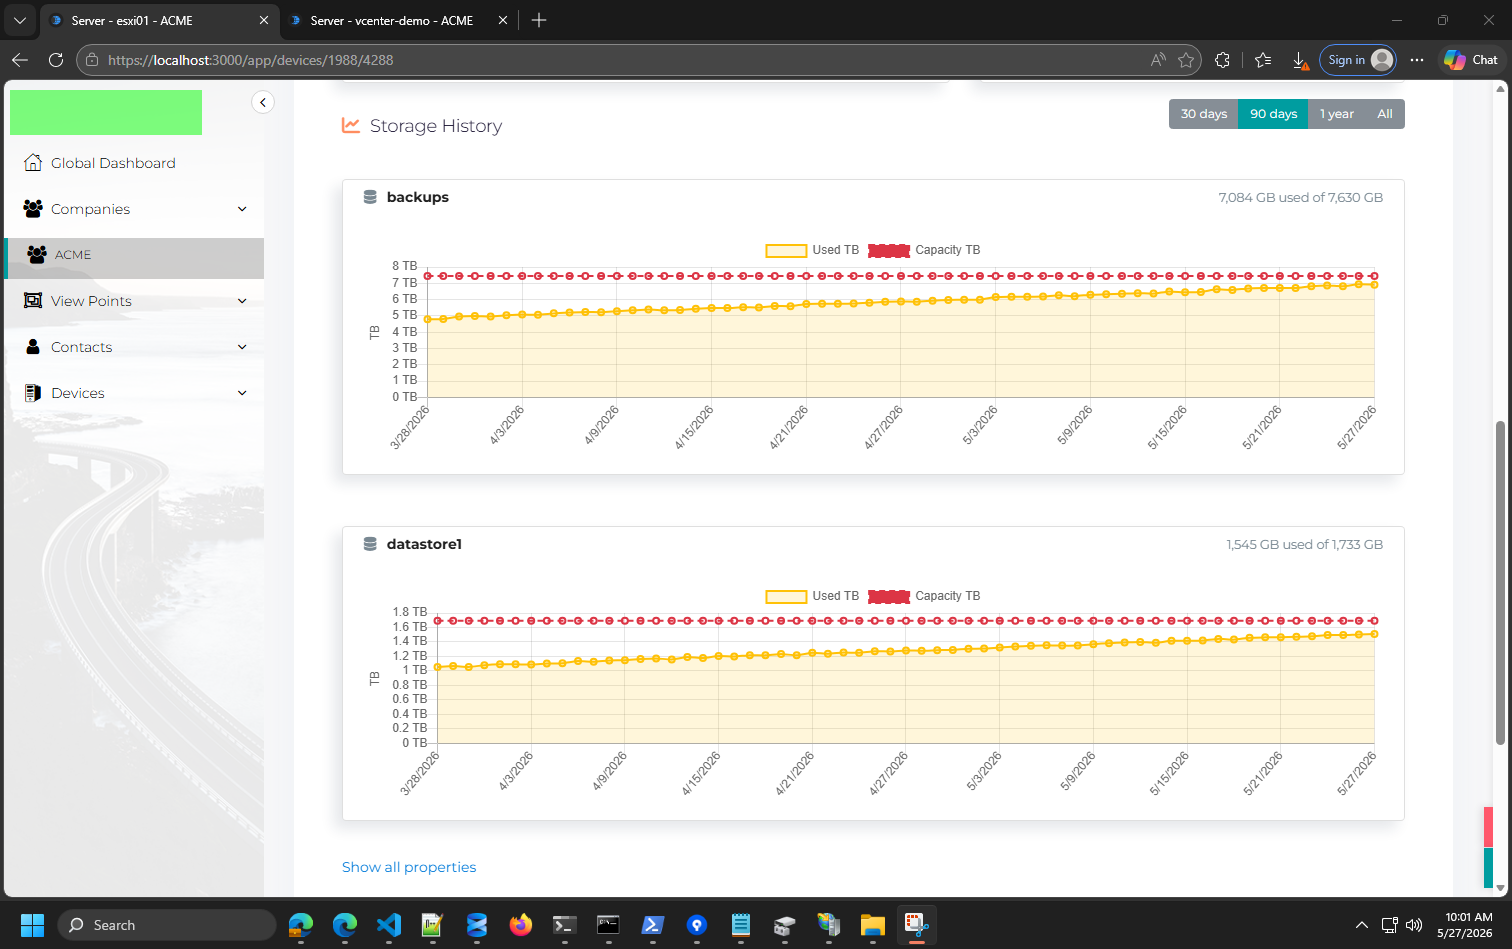
If a datastore is filling up faster than you noticed, the chart tells you weeks before vCenter does.
A change history you can actually read
This is the biggest addition. Every VM now keeps a running log of user-initiated actions captured straight from vCenter Events — power on/off, reconfigure, rename, snapshot, vMotion, disk add/resize/remove, NIC changes. Each entry shows when, what, and who in vCenter did it.
Two things make this log worth keeping open instead of digging into vSphere's own Events view:
-
Humanized values. Instead of the raw VMware event text —
config.hardware.memoryMB: 4096 -> 8192— you see RAM: 4.00 GB → 8.00 GB. Disk resizes show in TB/GB. NIC adds list the MAC. Renames flatten to old → new. The original detail is still one click away on a small (i) icon, but the default view is the version you'd actually paste into a ticket. -
No noise. Automated background activity from
vpxd,vpxuser, service accounts, and vCenter's internal task events is filtered out at collection time, so the log focuses on real human actions. The result is short, scannable, and useful in a postmortem.
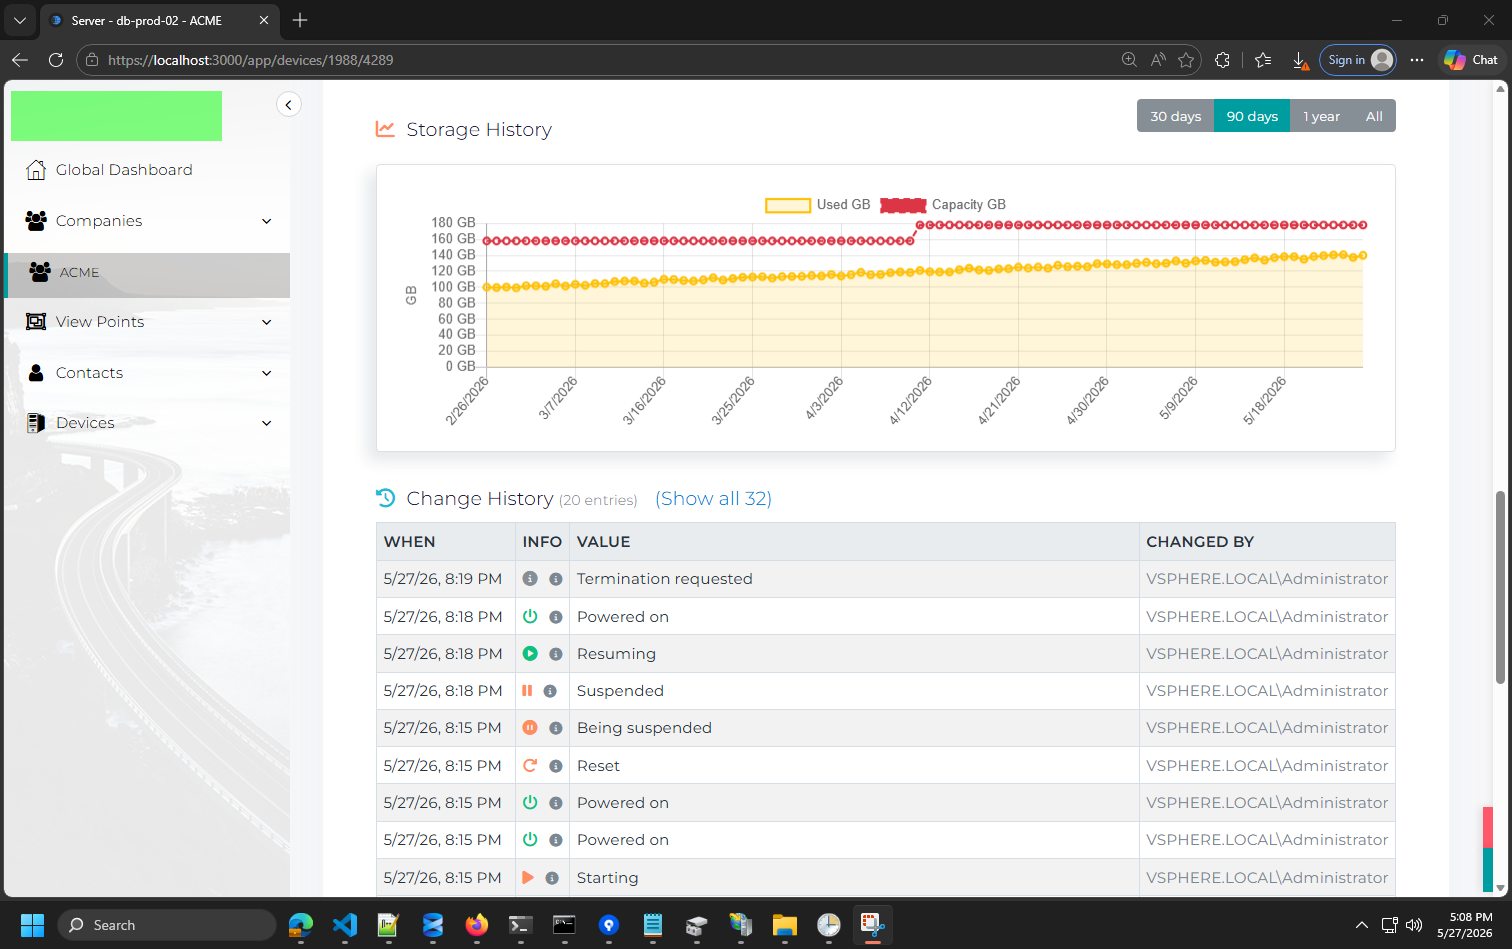
Import Mappings — new devices, automatically
You no longer have to add VMs to IT Portal by hand. Set up a couple of rules under Admin Settings › Integrations › VMware › Mappings and the agent does it for you on every sync.
Each rule is one of two kinds:
- Device Type rules decide what gets created. "OS contains Server" → create as Server. "OS does not contain Server" → create as Workstation. "Name starts with fw-" → Firewall. You pick the field (Name, OS, Folder, Tags, ResourcePool, Network, Host, Datastore), the operator (contains / does not contain / equals / starts with / ends with / regex), and the value.
- Site rules decide where a created device lands. "Name contains prod" → Birkenhead site. Without a Site rule match, devices go to the site assigned to the agent (and that site's company).
New devices come in pre-populated with the VM's name, IP, MAC, OS, vCPU count, RAM, and host/cluster, and Make/Model show as VMware / Virtual Machine. Existing devices are never overwritten — the rule engine only acts on VMs that don't already have a matching Portal device.
When you edit a rule later (say, change Workstation → Server), every device that was originally created from that rule is updated automatically. No re-import needed.
Smaller improvements you'll notice
A handful of quieter changes that landed in the same release:
- vSphere tags now render as color-coded pills (one color per category) instead of the raw
Category:Name,Category:Namestring we used to dump in the field. - Matching between Portal devices and VMware objects now uses IP and MAC addresses in addition to the device name — so more of your existing inventory auto-links to its VMs without manual intervention.
- The data-collection agent can now run as the local SYSTEM account. No more dedicated service-account password to manage, no more daily collection breaking when a user's password expires. The first time you run the agent it offers to schedule itself, at a random off-peak hour, so multiple agents don't all hit vCenter at the same minute.
- Standalone ESXi support — introduced a few days ago — carries through unchanged. The same single agent handles vCenter and standalone ESXi alike.
Availability
These changes ship with release 4.6.27.