Your monitoring dashboard lights up with another critical alert at 2 AM.
But no one knows what the server does, who owns it, or how to fix it - because the documentation is missing or outdated.
This is the hidden reality for most growing IT teams and MSPs at scale. Monitoring tools promise visibility, but without strong IT documentation for monitoring teams, they deliver noise instead of answers.
This post explains why monitoring tools fail at scale, the exact problems that emerge, and how the right documentation system makes your monitoring stack effective.
What “Scale” Actually Breaks
As your infrastructure expands, three things happen simultaneously:
- More devices, networks, and applications generate exponentially more alerts.
- Teams grow and institutional knowledge walks out the door with every departing engineer.
- Without documentation, monitoring dashboards turn into overwhelming chaos boards instead of actionable intelligence.
For MSPs, this problem multiplies. It's not one infrastructure at scale - it's dozens of client environments, each with different escalation paths, different asset owners, and different service expectations. A missing runbook doesn't just slow down one team; it slows down every technician who touches that client after hours.
Scale doesn't break the monitoring tool itself. It exposes the missing foundation underneath it.
Monitoring Shows the Alert. Documentation Shows the Context.
A monitoring tool can tell you that something is wrong. It can rarely tell you what it means. Is this server business-critical or a low-priority test box? Does it belong to one client or feed into several? Who's the right person to call at 2 AM?
That gap between "here's an alert" and "here's what to do about it" is where MTTR quietly balloons - and it's the gap documentation is built to close.
The 5 Ways Monitoring Tools Fail Without IT Documentation
- Alerts with no context: You know something is broken, but not what it affects or how critical it really is.
- No ownership clarity: An alert fires at 2 AM. Who's responsible? Without documented ownership, precious minutes are lost in escalation. For MSPs, this often means guessing which client the asset belongs to before you can even start troubleshooting.
- Missing network dependency maps: You can't trace the blast radius of an issue when infrastructure relationships aren't documented.
- Runbooks that don’t exist: Monitoring catches the incident, but there's no documented procedure telling the team exactly how to resolve it - and no client-specific steps to follow when different accounts require different handling.
- Onboarding gaps for new engineers: New or after-hours technicians can't act confidently on alerts for systems they've never seen properly documented, which keeps senior staff on call far more than they should be.
What Good IT Documentation Looks Like Alongside Monitoring
Strong documentation doesn't replace monitoring - it supercharges it. At a minimum, it should give technicians:
- Server/device owner - who is accountable for this asset
- Client or site relationship - especially critical for MSPs managing multiple accounts
- Criticality level - so severity is clear at a glance
- Linked runbook - the exact steps to resolve common issues
- Last known configuration - a baseline to compare against
- Related assets or dependencies - what else could be affected
- Escalation contact - who to call, and in what order
When monitoring and documentation work together, alerts become immediately actionable.
Real-World Scenario: Monitoring With vs. Without Documentation
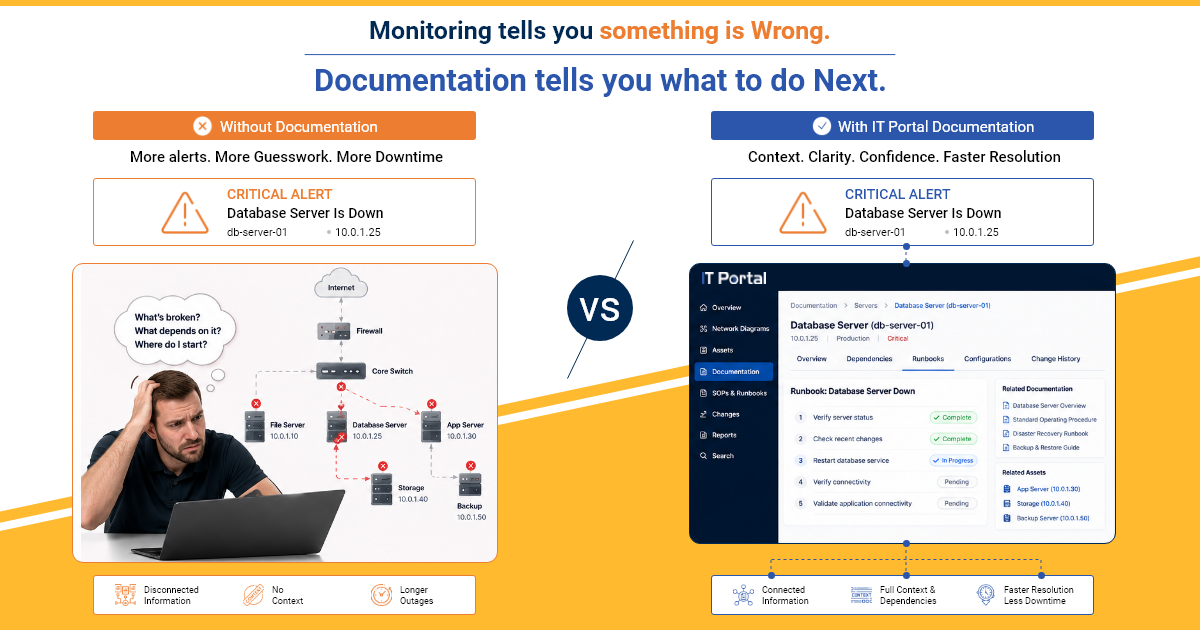
Without documentation: A CPU alert fires on a server. The technician doesn't know which client service depends on it, who owns the box, or whether it's safe to restart. They spend the next 25 minutes tracking down answers before they can even start fixing the actual problem.
With proper documentation: The same alert fires. The technician instantly sees the server owner, the client it belongs to, related services, the escalation contact, and the relevant runbook steps - all in one place. They can start resolving the issue immediately instead of investigating who to ask.
The difference isn't a guarantee of a fixed resolution time - every incident is different - but in general, the technician can respond with more context and spend less time investigating, which tends to reduce time to resolution.
How IT Portal Closes the Gap
- IT Portal turns documentation into a living system that supports monitoring teams:
- Hierarchical structure that mirrors your actual infrastructure - and, for MSPs, your actual client accounts
- Centralized records for devices, configs, and dependencies
- Linked runbooks and procedures directly accessible during incidents
- Change history that helps teams review documented updates that may be relevant to an alert
This makes every monitoring alert far more actionable - and reduces how often after-hours issues have to escalate straight to your most senior technician.
Your monitoring tools become dramatically more effective when they operate on top of clean, structured documentation.
Ready to stop turning alerts into guessing games? Book a demo to see how IT Portal helps teams centralize infrastructure documentation, runbooks, ownership details, and change history so alerts are easier to act on.